
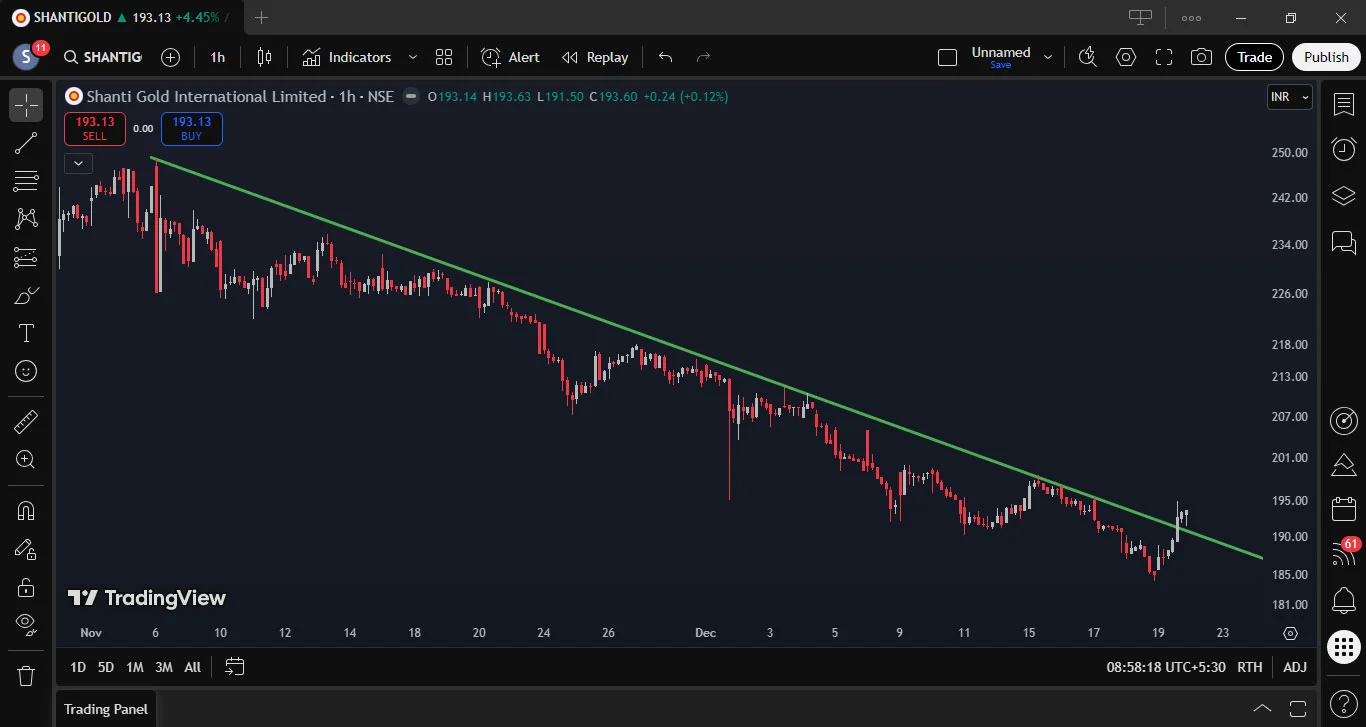
This 1-hour chart of Shanti Gold International Ltd shows a strong and sustained downtrend, clearly marked by a descending trendline connecting multiple lower highs. Price consistently respected this trendline, confirming persistent selling pressure. Recently, the stock bounced from lower levels and is attempting to break above the trendline. This zone is critical, as a confirmed breakout may signal a short-term trend reversal, while rejection could lead to further downside or consolidation.
Swing Trade Details:
- Stock Name: Shanti Gold International Limited
- Trade Type: Trendline Breakout
- Upside Potential: 29.00%