
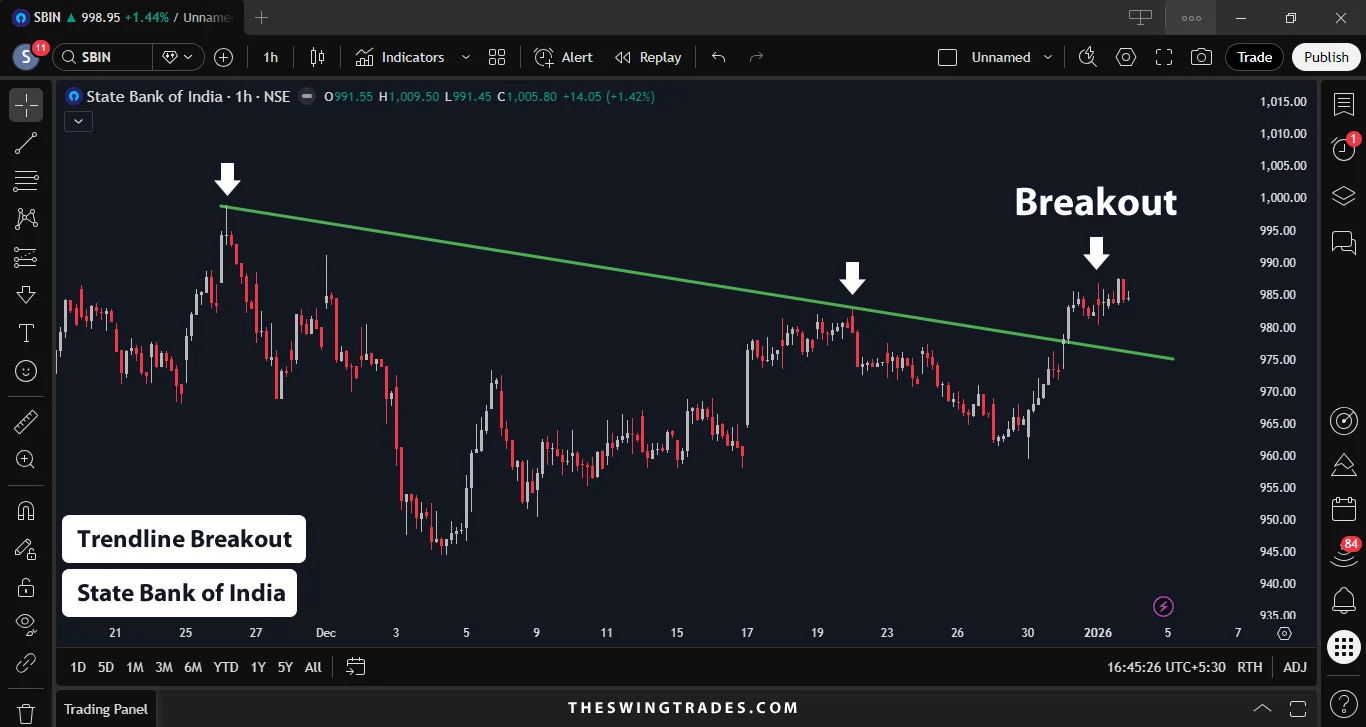
This 1-hour chart of State Bank of India (SBI) shows a well-defined descending trendline that acted as strong resistance for several weeks. Price faced multiple rejections at this trendline, indicating persistent selling pressure. Recently, SBI has given a clean breakout above the trendline with strong bullish candles, signaling a potential trend reversal. Sustaining above the breakout zone may open the door for further upside momentum in the near term.
Swing Trade Details:
- Share: State Bank of India
- Share Price: 977.00 – 987.00
- Trade Type: Trendline Breakout
- Upside Potential: 15.00%