
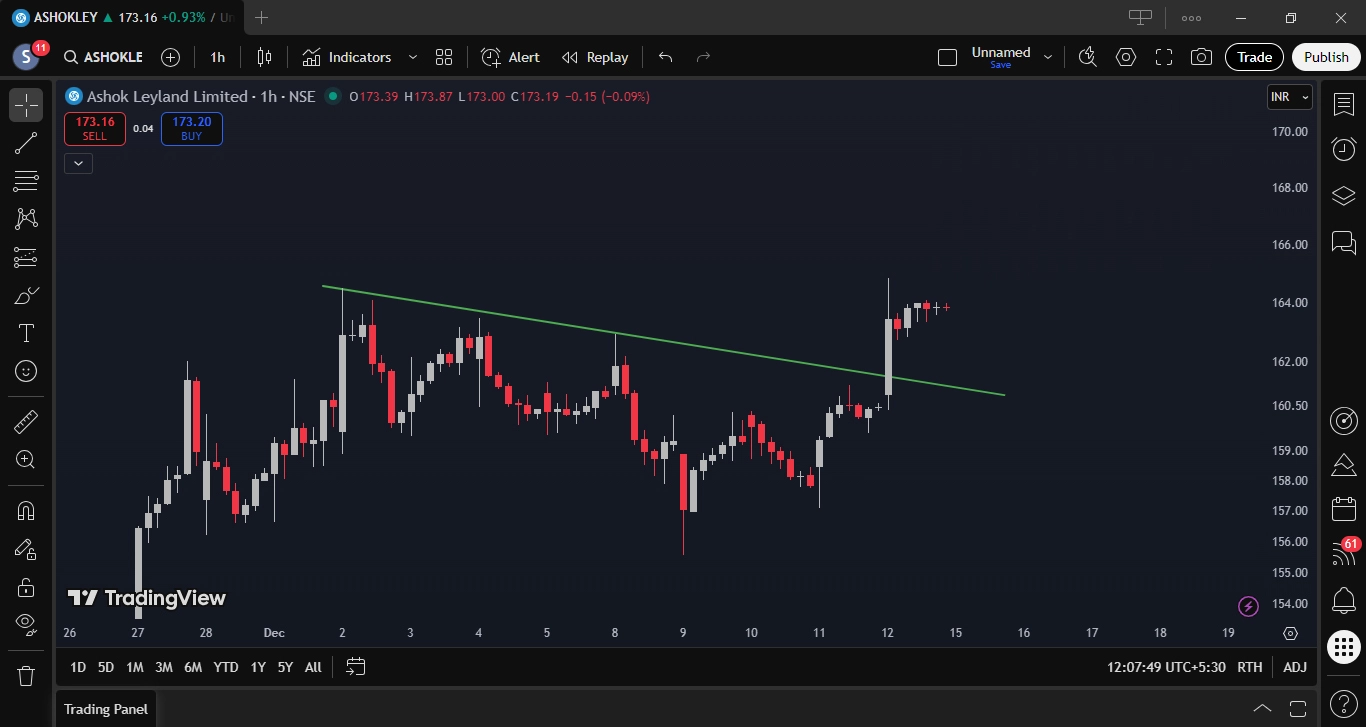
This 1-hour chart of Ashok Leyland shows a corrective phase marked by a descending trendline, indicating selling pressure at higher levels. Price respected this trendline multiple times before staging a strong bullish move from recent lows. The sharp upward candle suggests a decisive breakout above the trendline, followed by consolidation near higher levels. This price action points toward improving momentum and a possible short-term trend reversal, pending confirmation through sustained buying and volume support.
Swing Trade Details:
- Stock Name: Ashok Leyland Limited
- Trade Type: Trendline Breakout
- Upside Potential: 5.00%