
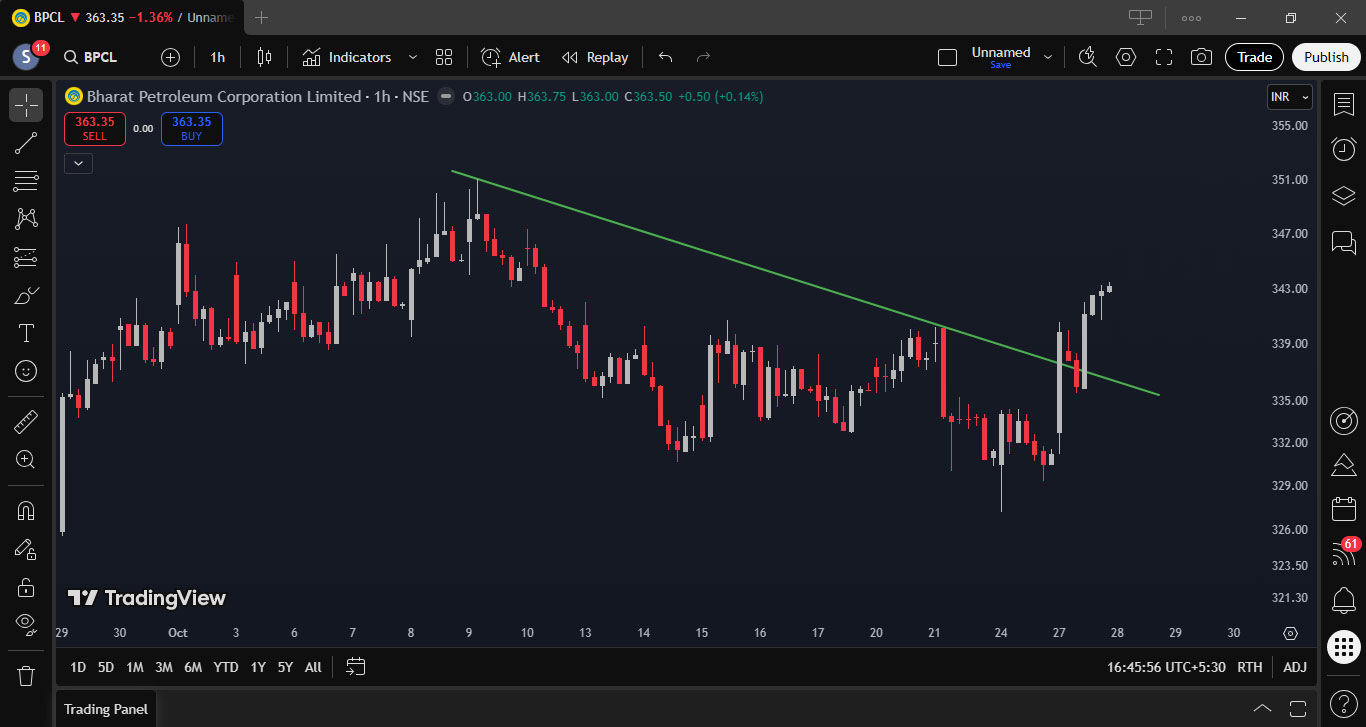
This 1-hour chart of BPCL shows a clear downtrend marked by a descending trendline, indicating consistent selling pressure at higher levels. Price respected this trendline multiple times before showing a strong bullish move from lower support. The recent sharp upward candles suggest a potential breakout above the trendline and short-term trend reversal. Confirmation through sustained price action and volume will be important to validate further upside momentum.
Swing Trade Details:
- Stock Name: BPCL
- Trade Type: Trendline Breakout
- Upside Potential: 5%
Updates:
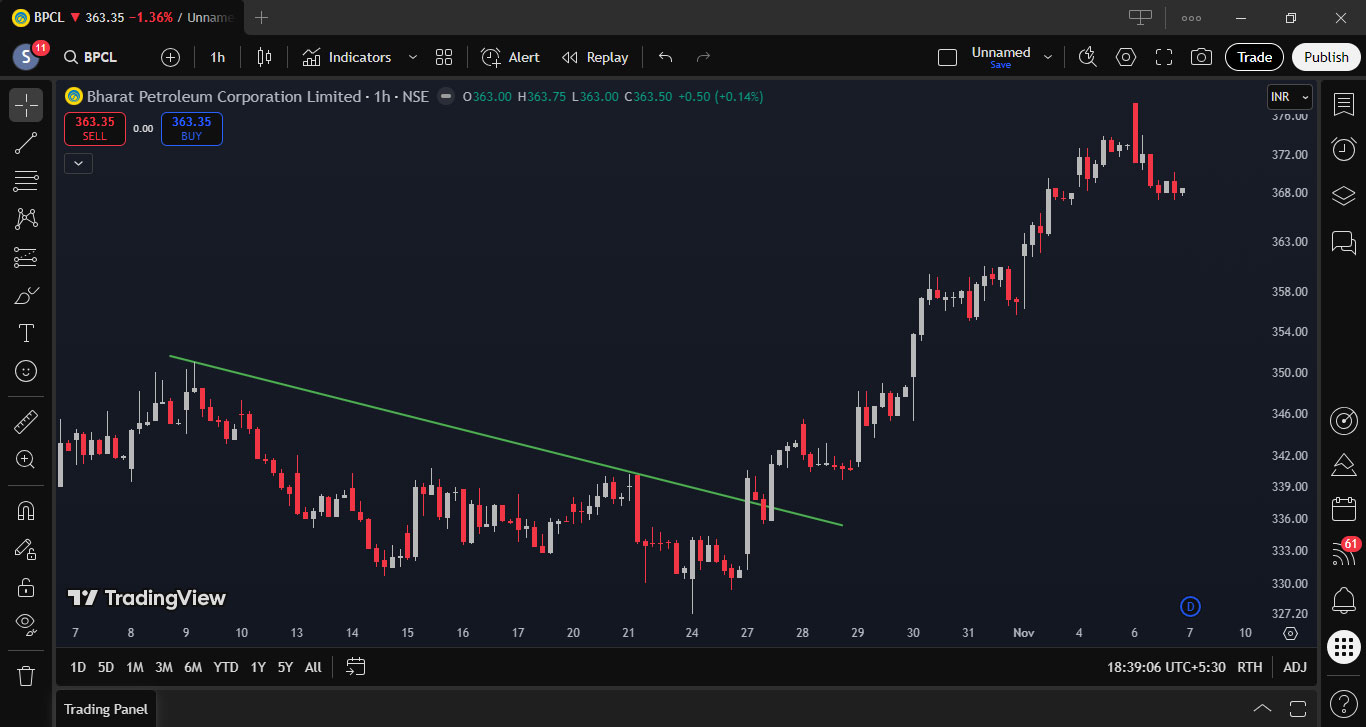
Trade Updates:
- Status: Closed
- Entry: 341.00
- Exit: 373.00
- Duration: 9 Days
- Returns: 9.10%
Disclaimer:
This content is for educational purposes only. Stock market trading involves risk. The strategies shared here are based on personal experience and are not financial or investment advice. Past performance does not guarantee future results. Trade at your own risk.