
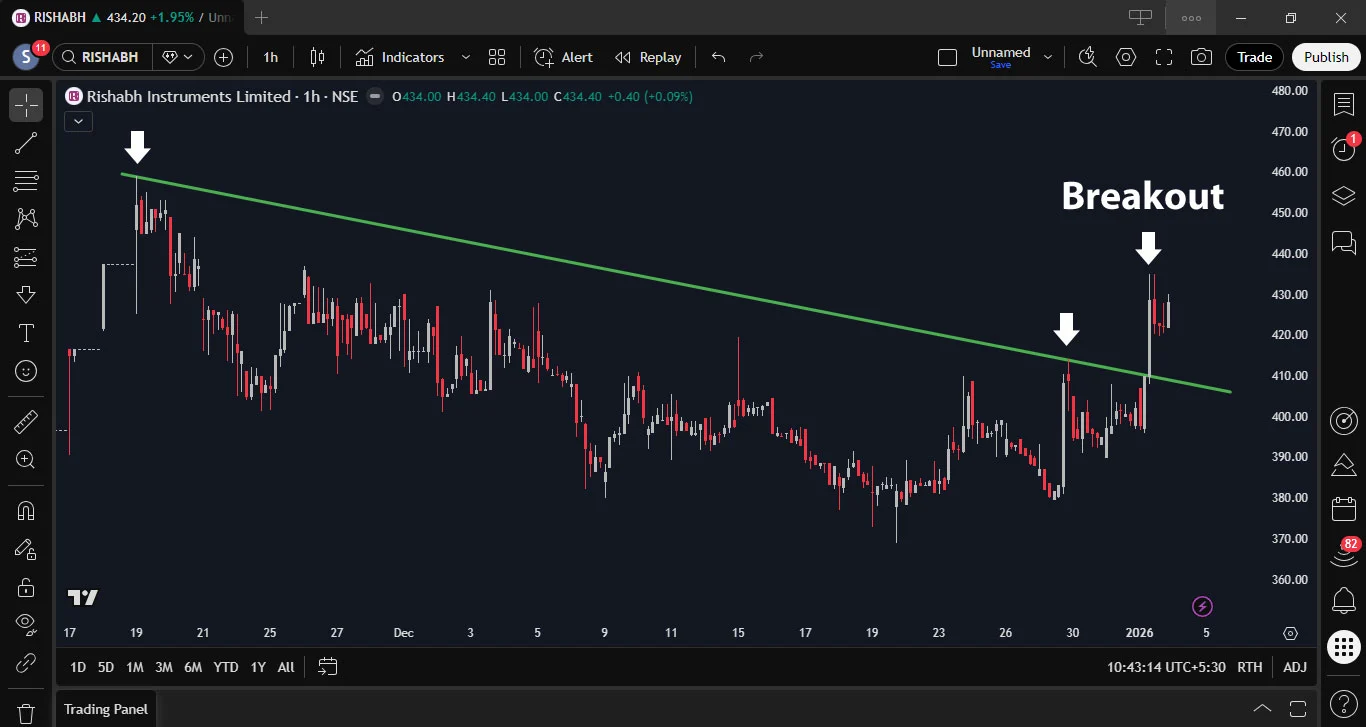
This 1-hour chart of Rishabh Instruments Ltd shows a long-term descending trendline that acted as strong resistance throughout the period. The stock faced multiple rejections near this level, confirming sustained bearish pressure. Recently, price has given a clean and decisive breakout above the trendline with strong bullish candles. This breakout indicates a possible short-term trend reversal, and if the price sustains above the breakout zone, further upside momentum and continuation can be expected.
Swing Trade Details:
- Stock Name: Rishabh Instruments Limited
- Trade Type: Trendline Breakout
- Upside Potential: 8.00%