
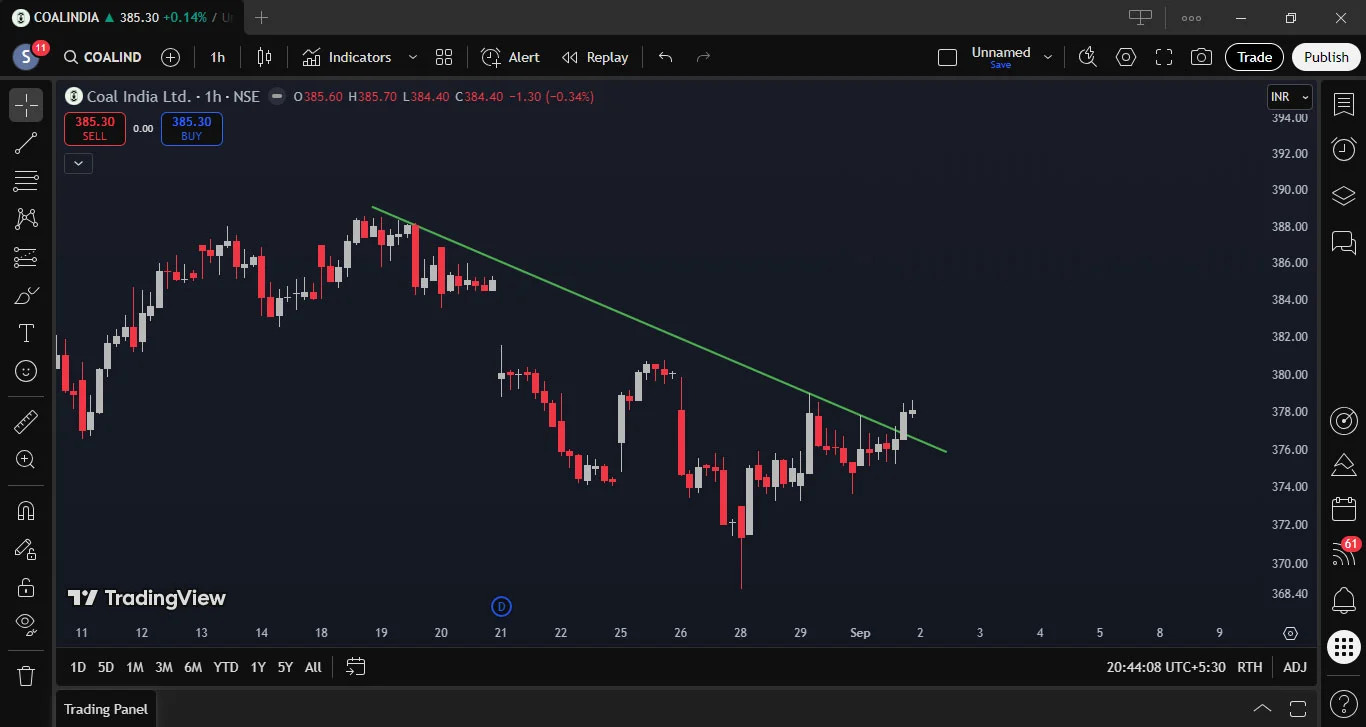
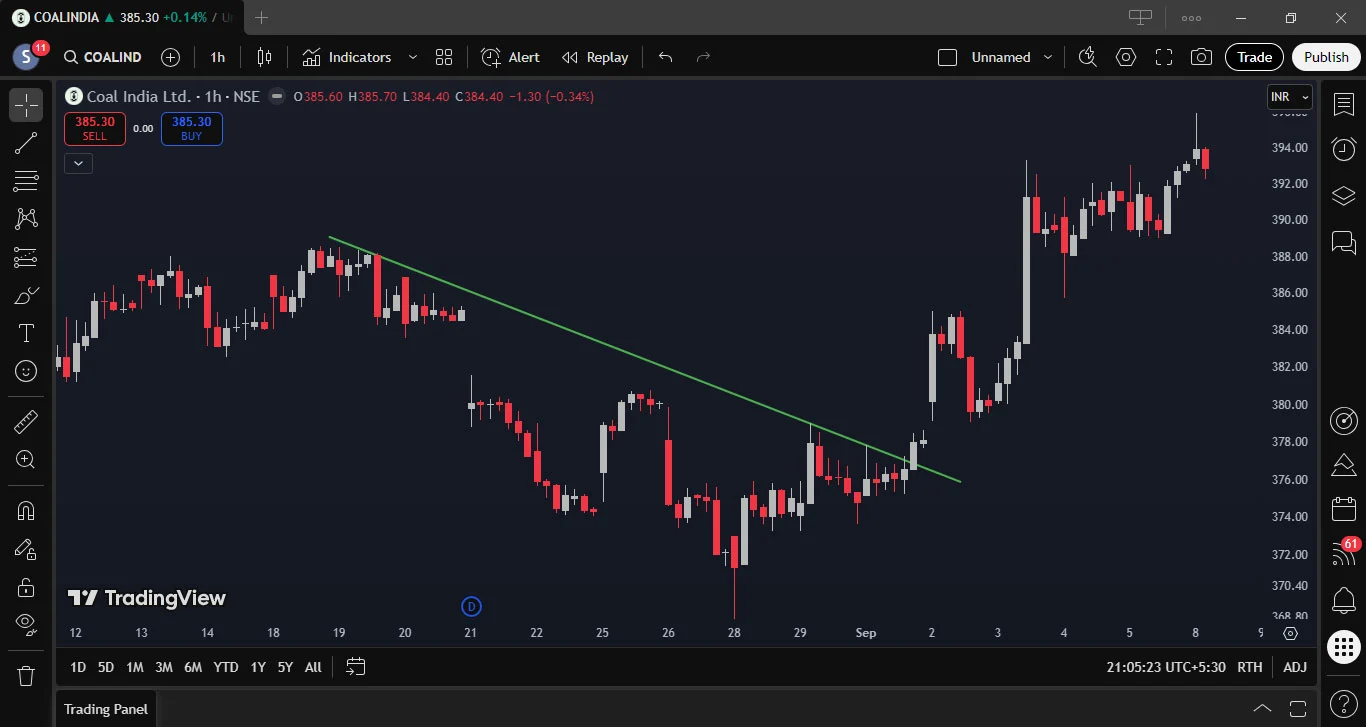
This 1-hour chart of Coal India Ltd shows a corrective phase within a broader structure, highlighted by a descending trendline connecting lower highs. Price earlier respected this trendline, indicating selling pressure during pullbacks. Recently, the stock moved back toward the trendline with improving momentum, suggesting a potential breakout or near-term reversal attempt. A sustained close above the trendline, supported by volume, would strengthen the bullish case.
Swing Trade Details:
- Stock Name: Coal India Ltd.
- Trade Type: Trendline Breakout
- Upside Potential: 3.50%
Updates:
Trade Updates:
- Status: Closed
- Entry: 379.00
- Exit: 393.00
- Duration: 6 Days
- Returns: 3.70%