
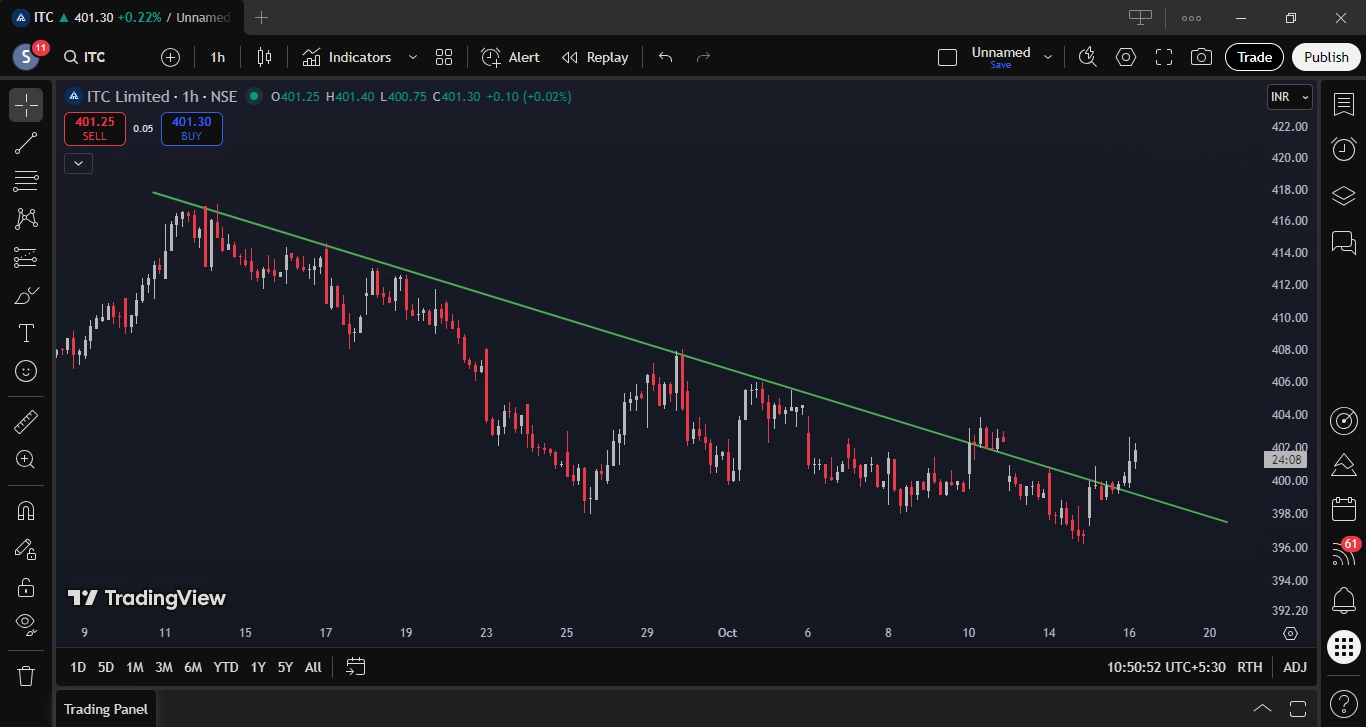
This 1-hour chart of ITC shows a prolonged downtrend defined by a steadily declining trendline, indicating persistent selling pressure on every pullback. The price respected this trendline multiple times before forming a recent bullish move from lower levels. The latest candles suggest an attempted breakout above the trendline, signaling a possible short-term trend change. Sustained price action and volume confirmation will be key to validate further upside.
Swing Trade Details:
- Stock Name: ITC Limited
- Trade Type: Trendline Breakout
- Upside Potential: 6.00%
Updates:
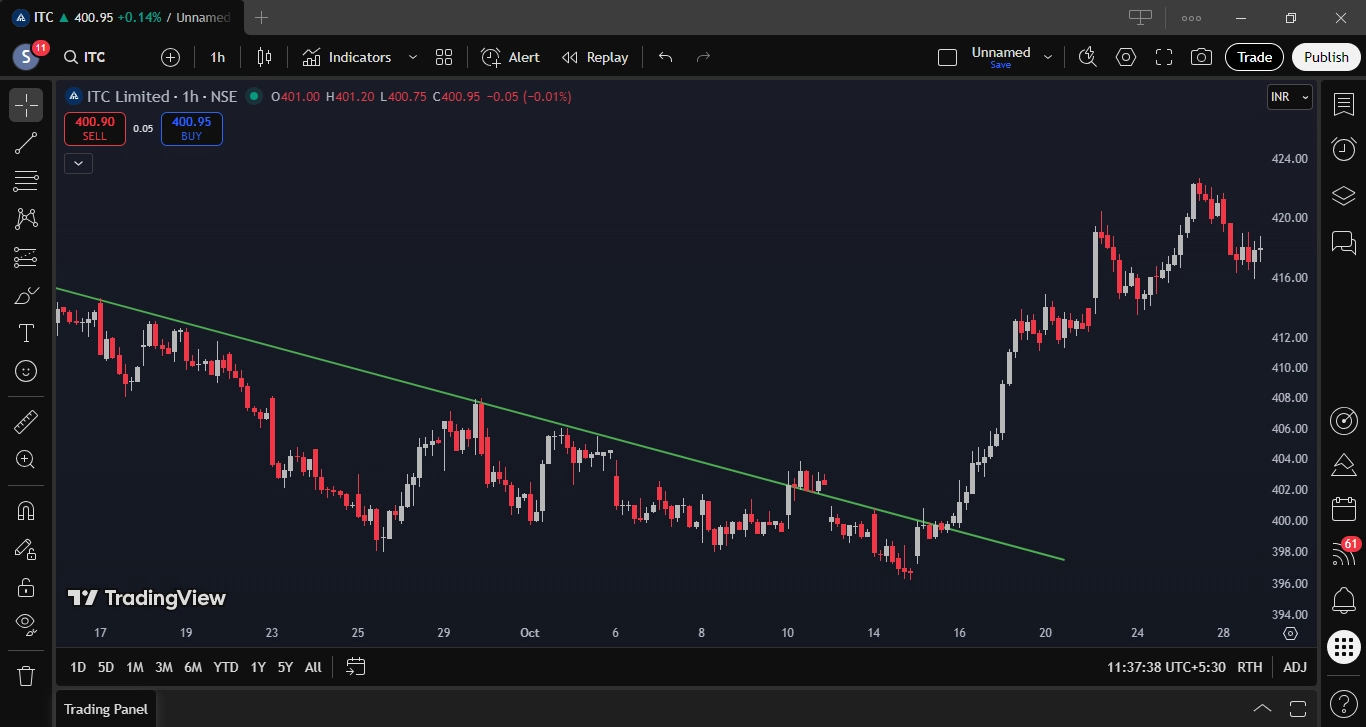
Trade Updates:
- Status: Closed
- Entry: 401.00
- Exit: 420.00
- Duration: 11 Days
- Returns: 4.60%