
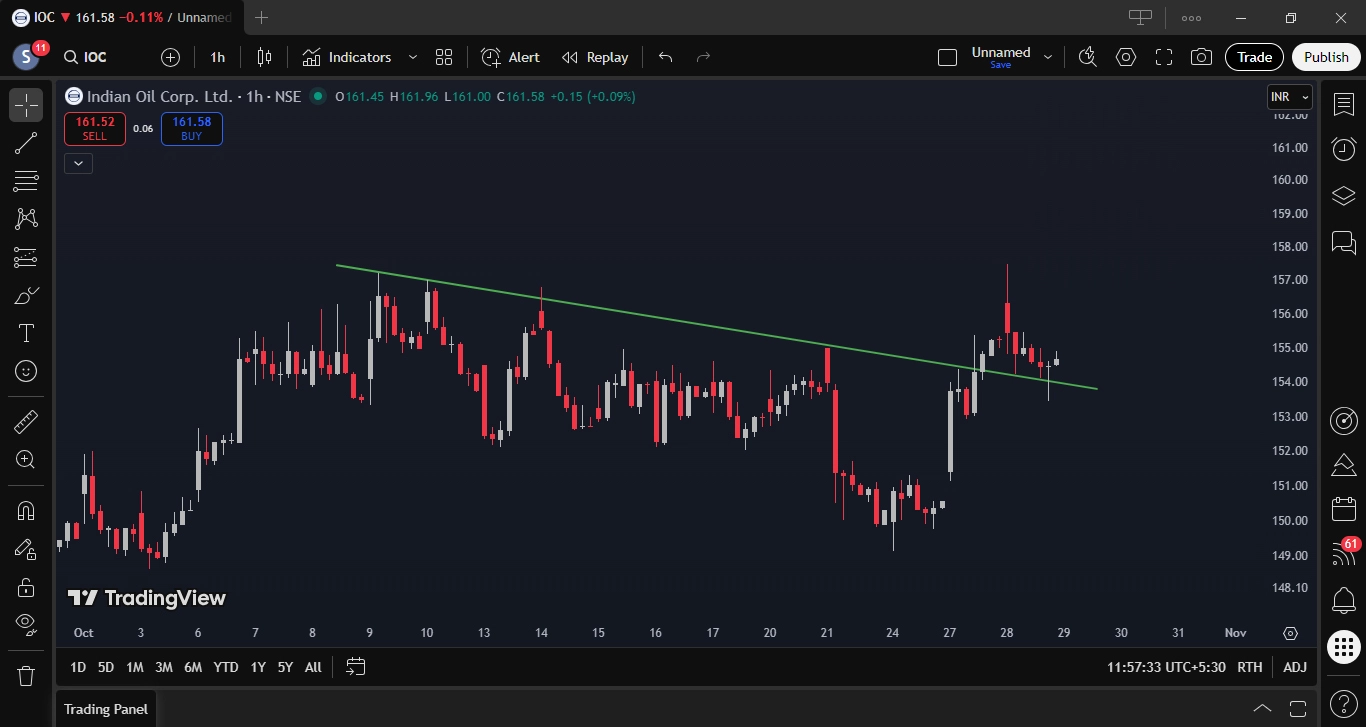
This 1-hour chart of Indian Oil Corporation (IOC) shows a mild downtrend marked by a descending trendline connecting lower highs. Price respected this trendline several times, indicating supply at higher levels. Recently, the stock bounced strongly from lower support and is now consolidating near the trendline. This behavior suggests a potential breakout or rejection zone, where confirmation through price action and volume will guide the next directional move.
Swing Trade Details:
- Stock Name: Indian Oil Corp. Ltd.
- Trade Type: Trendline Breakout
- Upside Potential: 6.00%